Problems with the Number Needed to Treat
absolute risk reduction, confidence intervals, incidence proportions, inverse of the absolute risk, number needed to treat, risk reduction
The number needed to treat (NNT) is a popular statistic used in medicine and its use is encouraged by groups like Cochrane and CONSORT. Even the famous statistician, Doug Altman was a big proponent of it. Why is it so popular? Most believe that the NNT is more understandable than measures like odds ratios or risk ratios or statistics like the absolute risk reduction. The NNT is also believed to convey more meaningful information.
In this blog post, I am going to discuss:
what the NNT is
how to calculate an NNT
some of the problems associated with the use of the NNT
solutions to the problems associated with the use of the NNT
The NNT is defined as the number of patients that need to be treated for one patient to experience a positive outcome or for one patient not to experience an adverse outcome. So, an NNT of 100 means that 100 patients need to be treated for one patient actually to benefit. The NNT is the inverse of the absolute risk reduction (ARR) (1/ARR). I will show how they are calculated with a sample contingency table from a controlled study comparing the drug Apixaban to placebo for recurrent thromboembolism (RT). Apixaban is the treatment for the first row and placebo is the treatment for the second row. Bolded numbers are the totals.
| Recurring Events | Non Recurring Events | Total Events | |
|---|---|---|---|
| Apixaban | 14 | 826 | 840 |
| Control | 73 | 756 | 829 |
| Total Events | 87 | 1582 | 1669 |
Calculations
We will calculate four different measures: incidence proportions, absolute risk reduction, relative risk, and then the NNT.
Incidence Proportions
In the group that received the drug, 14 people experienced RT out of 840 people (14/840). So, about 1.7%. In the control group, 73 people experienced disease progression out of 829 people (73/829), which is 8.8%. These are incidence proportions.
Absolute Risk Reduction
We calculate the absolute risk reduction by finding the difference between the incidence proportions: 8.8% (control group) - 1.7% (treatment group) = 7.1% So, the use of the drug Apixaban lowered the absolute risk of RT by 7.1%.
Relative Risk
Most people do not enjoy thinking in terms of absolute risk reduction, and they prefer to think in terms of relative risk. We calculate the relative risk by taking the incidence rates and dividing them by one another. So, 8.8% / 1.7% = 5.2
In words, patients who took placebo were 5.2 times more likely to develop RT than patients who took Apixaban.
We can also do 1.7% / 8.8% = 0.19, which means that people who were treated with Apixaban had 19% of the risk that the control group had in developing RT.
Numbers Needed to Treat
Relative risk is more easily understood than absolute risk reduction, but relative risk can also be deceiving, and most in medicine prefer to work with absolute risk reduction, so they prefer to use the numbers needed to treat which can be calculated by taking the inverse of the absolute risk reduction which is 1 / 7.1 = 14. This means that 14 people need to be treated with Apixaban to prevent one case of recurrent thromboembolism.
Now that we know how to calculate the NNT, we can discuss the problems with it.
A minor note before I get into this, some statisticians are entirely against the use of the NNT because they believe that it has poor statistical properties mainly due to its non-monotonicity and fusion with infinity as a possible value (Duncan & Olkin, 2005; Hutton, 2000; Kristiansen, Gyrd-Hansen, Nexøe, & Nielsen, 2004; Stang, Poole, & Bender, 2010; Wu & Kottke, 2001).
There are also several other problems such as bias that cannot be corrected for and difficulty calculating confidence intervals with standard errors. Most of these statisticians recommend using the absolute risk reduction instead because it has good statistical properties.
I have listed the papers in the reference section of this article.
Major Problem: Missing Information
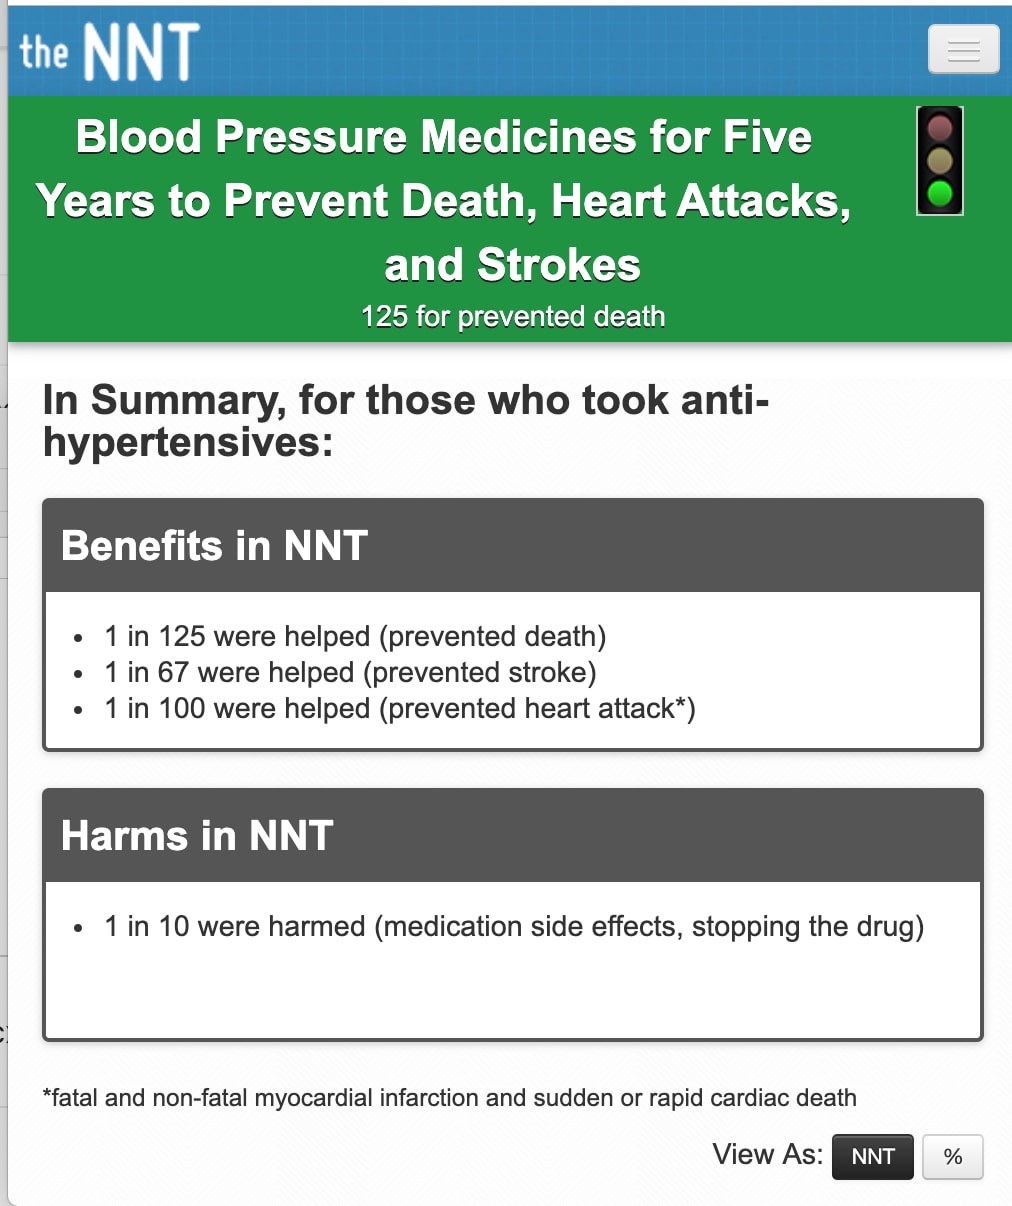
A significant problem with the use of the NNT is that it does not provide much information. For example, if we look at the NNT group website, a popular website that classifies interventions by the NNT of an intervention, this is what they have listed at the top of the page for blood pressure medication and mortality/CVD outcomes
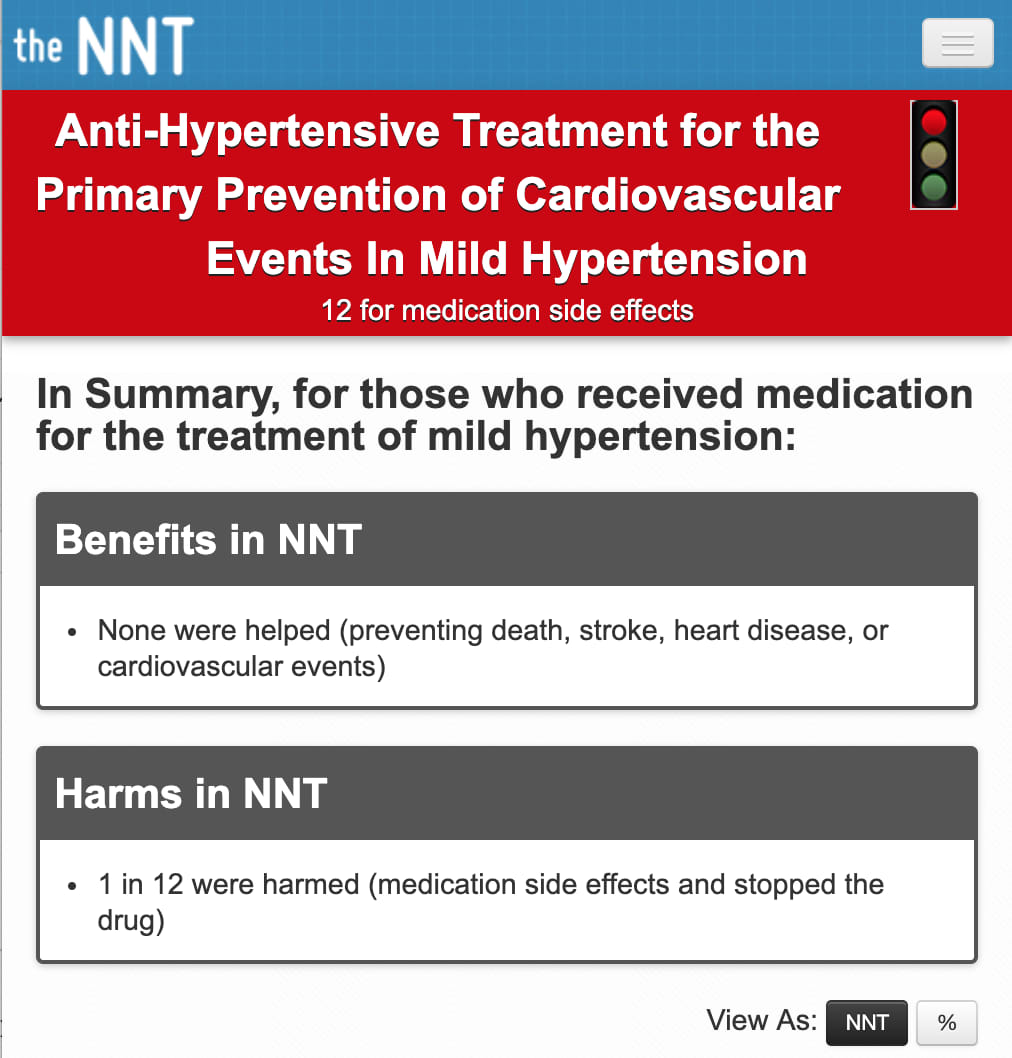
And another page about hypertension but mainly focused on primary prevention.
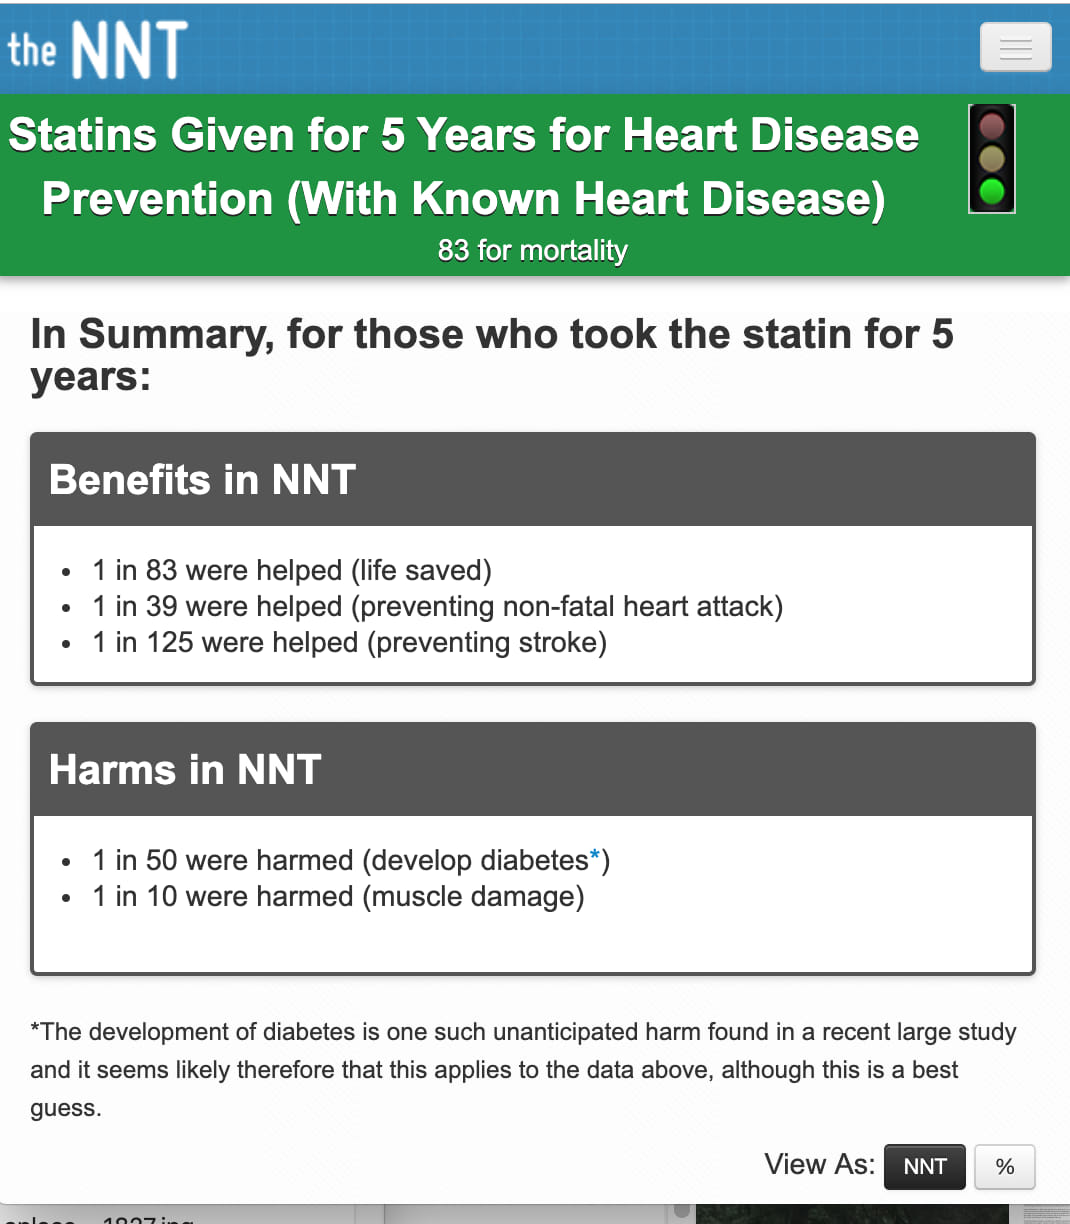
Then one on statins.
Comparator
Now, most people might take these NNTs and compare them across the board, but unfortunately, you cannot do this if you do not know what the comparators being used here are. The NNT group does have the comparators listed in the middle of the page, but they should be at the top right next to the NNT.
Is it likely that statins are superior to antihypertension medication for primary prevention of CVD events? Probably, I’m not entirely sure. Can we compare them this easily by using only NNTs? No.
As (Stang et al., 2010) points out,
“A statement such as ‘‘This antihypertensive drug has an NNT of 50’’ is not informative unless the comparator is given.”
The NNT seem very easy to understand but are not interpretable without explicit mention of their comparator.
Solution: Explicitly state the comparator next to each NNT.
Uncertainty
Another problem is the lack of confidence intervals for the NNTs. Again, NNTs are point estimates, and the uncertainty of the estimate should be displayed right next to the estimate; otherwise, readers will be fooled into thinking that the number is a definitive estimate.
Solution: Calculate and display the confidence intervals of the NNT right next to it.
Time Period
An NNT without the accompanying time period of the trial or cohort is genuinely meaningless and deceptive when compared across the board. For example, if fish oil for preventing heart attacks had a hypothetical NNT of 10,000 in an RCT that was one year long, and another NNT that was 500 in an RCT that was ten years long, you cannot just blindly compare an NNT of 10,000 to an NNT of 500. Perhaps the intervention takes a long time to work. You are, again, missing vital information if you state the NNT without any accompanying information.
Solution: State the time period of the study that the NNT is calculated from.
Rounding NNTs
Another typical behavior is to round NNTs up because most people do not think it makes much sense to think of part of a patient. For example, people would rather not think that it takes 14.3 patients for one patient to benefit, so they round up. This is a mistake because numbers needed to treat were never meant to be discrete integers, they are estimates and the inverse of risk reductions.
Here’s an example by Stang et al.:
If we had an absolute risk reduction that could be between 0.349 and 0.49 and we took the numbers needed to treat from the absolute risk reduction in this interval, they would all round up to 3!
1 / 0.349 = 2.865 is the NNT when the absolute risk reduction is 0.349
1 / 0.40 = 2.5 is the NNT when absolute risk reduction is 0.4
1 / 0.49 = 2.04 is the NNT when absolute risk reduction is 0.49
In practice, all of these NNTs would be rounded up to 3, when there are apparent differences between the absolute risk reduction. NNTs should not be rounded up to the nearest whole integer out of a fear of working with decimals because this will lead to omission of valuable information.
Solution: Don’t round the NNT to the nearest whole integer.
As we can see, numbers needed to treat are not free of problems. While they may convey information that is a lot more intuitive, the statistic itself does not seem to be without issues, and the way they are used in medicine is also a problem. However, a lot of these issues may be circumvented with proper reporting, which may be an improvement over current practice, however, the issues still remain with their statistical properties.
See also: What Makes a Sensitivity Analysis? — the hub piece tying this material to the broader cluster on assumptions, robustness, and what happens when models bend.
References
Duncan, B. W., & Olkin, I. (2005). Bias of estimates of the number needed to treat. Statistics in Medicine, 24(12), 1837–1848. https://doi.org/10.1002/sim.2076
Hutton, J. L. (2000). Number needed to treat: properties and problems. Journal of the Royal Statistical Society: Series A (Statistics in Society), 163(3), 381–402. https://doi.org/10.1111/1467-985X.00175
Kristiansen, I. S., Gyrd-Hansen, D., Nexøe, J., & Nielsen, J. B. (2004). Goodbye NNT. Journal of Clinical Epidemiology, 57(2), 221. https://doi.org/10.1016/j.jclinepi.2003.09.001
Motulsky, H. (2014). Intuitive Biostatistics: A Nonmathematical Guide to Statistical Thinking. Oxford University Press.
Stang, A., Poole, C., & Bender, R. (2010). Common problems related to the use of number needed to treat. Journal of Clinical Epidemiology, 63(8), 820–825. https://doi.org/10.1016/j.jclinepi.2009.08.006
Wu, L. A., & Kottke, T. E. (2001). Number needed to treat: caveat emptor. Journal of Clinical Epidemiology, 54(2), 111–116. Retrieved from https://www.ncbi.nlm.nih.gov/pubmed/11166524
Comments