
#' @title Simulation of valid P-values where test hypothesis is true
#' @param X The first variable we are simulating
#' @param Y The second variable we are simulating
#' @param n.sim # The number of simulations
#' @param t The object storing the t-test results
#' @param t.sim # Empty numeric vector to contain values
#' @param n.samp # Sample size in each group
#' @NOTE The null hypothesis does not have to be 0, it can be any value.

n.sim <- 10000
t.sim <- numeric(n.sim)
n.samp <- 1000

for (i in 1:n.sim) {
  X <- rnorm(n.samp, mean = 0, sd = 1)
  Y <- rnorm(n.samp, mean = 0, sd = 1)
  df <- data.frame(X, Y)
  t <- t.test(X, Y,
    mu = 0, paired = FALSE,
    var.equal = TRUE, data = df)
t.sim[i] <- t[[3]]}Your Models Are Neither Useful Nor Approximate
Forget About Them Being Right
statistics
A discussion about models and the assumptions that underlie them.
Keywords
sensitivity analysis, tipping point analysis, uncertainty analysis, robust analysis, multiverse analysis, exploring assumptions, bias analysis, statistical models, model assumptions
If the assumptions of a model are not derived from theory, and if predictions are not tested against reality, then deductions from the model must be quite shaky. However, without the model, the data cannot be used to answer the research question. Indeed, the research hypothesis may not really be translatable into an empirical claim except as a statement about nominal significance levels of coefficients in a model. - David Freedman, 1991
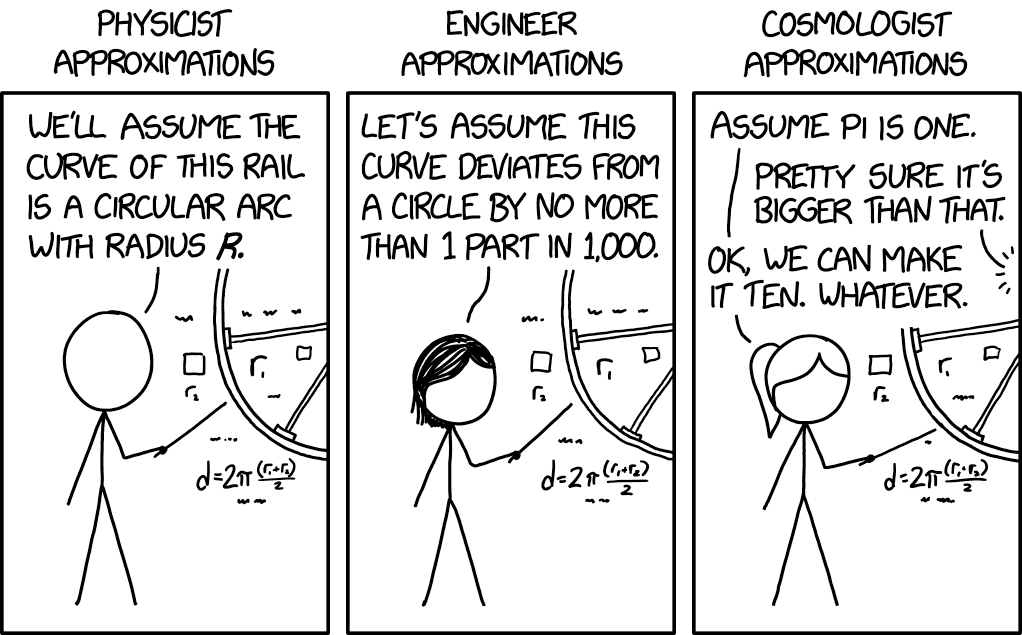
Statistical Models as Approximations
Scientific inference is a highly complex process often accompanied by numerical outputs from statistical models. To some, such outputs are not convincing as they believe that anyone can lie with numbers, but the reality is that it is a lot easier to lie without them, making them crucial because if deployed correctly, they may be close approximations to reality. The presence of a statistical model can allow others to view an answer to a complex question from a numerical standpoint that many may be able to verify.
Unfortunately, there are rampant issues in the building, reporting, and interpretation of such statistical models, and such issues can lead to devastating policies. We have elsewhere reviewed proposals to reform terminology and improve interpretations of conventional statistics by emphasizing logical and information concepts over probability concepts (1–3), as the latter has continued to confuse even well-credentialed statisticians familiar with the misinterpretations.
What Goes into a Model?
We here focus on how common descriptions of statistical outputs can be technically accurate yet still mislead when there is considerable uncertainty about what are known as background or auxiliary assumptions. Such uncertainty is typical in many contexts, where assumptions may include both mathematical and methodological ones:
For example, in the popular regression book by Gelman, the following assumptions are given for regression models in decreasing order of importance:
- validity
- additivity and linearity
- independence of errors
- equal variance of errors
- normality of errors
This is typical to see in many regression modeling books, but important methodological assumptions underlying the model are rarely discussed such as:
- patient outcomes are independent
- interactions and trends follow the regression model used for analysis (e.g., linear or logistic)
- no uncontrolled confounding
- subject-selection bias
- measurement error
- sparse-data bias
- no selective reporting of results* based on their P-values, interval estimates, or any other output – or if there is such selection, any bias it could produce has been adjusted for (or blocked) in the computation and presentation of the final results.

In addition to these general statistical and methodological assumptions, many assume that the statistical model being fit is answering a proper scientific question that has been translated into a statistical one, with assumptions that match or approximate reality. When there is a disconnect between the scientific question and the statistical one being answered by the model, the analyst is committing a type-III error, and will produce statistical outputs with of little use, unless the assumption violations of the chosen and reported are interrogated/varied and considered in the overall analysis.
Many are not aware of what a type-III error is due to the focus on type-I and type-II errors. I paste the following definition from the APA dictionary, which I found myself agreeing with:
Type-III Error: the error that occurs when there is a discrepancy between the research focus and the hypothesis actually tested. For example, a Type III error would have happened if a researcher collected data on individual differences within a sample and determined the causes of variation but the question of interest concerned differences between populations. In other words, a Type III error involves providing the right answer for the wrong question. Also called Type 0 error.
Violation of Assumptions
Misleading interpretations arise because the descriptions of such statistical outputs are conditional on such assumptions (i.e., they treat them as given/being true), and so do not factor uncertainty regarding the assumptions into their assessments. While various risk-assessment methods can incorporate additional sources in quantified uncertainties, such methods demand considerably more skilled user input than do conventional regression methods (5–9) and still do not account for unquantified sources of uncertainty. We thus present a more direct and nontechnical approach based on logic and associated language to honor assumption uncertainty, called deconditioning.
For example, suppose that a model assumes independence, a common assumption in many statistical models, but this violated due to the presence of a correlation, this will lead to P-values that are invalid, demonstrable by their failure to achieve asymptotic uniformity.
For example, a model that is approximately correct will generate P-values that are asymptotically uniform (a characteristic used to assess the validity of P-values)

#' @title Simulation of invalid P-values where test hypothesis is false
#' @param n_simulations # The number of simulations
#' @param p_values The object storing the t-test results
#' @param p_value_data # Empty numeric vector to contain values
#' @param n_subjects # Sample size in each group
#' @param correlation # correlation to violate independence

library(MASS)
n_simulations <- 1000
n_subjects <- 50
correlation <- 0.5

generate_correlated_data <- function(n_subjects, correlation) {
    Sigma <- matrix(correlation, n_subjects, n_subjects) +
        diag(1 - correlation, n_subjects)
    data <- mvrnorm(n = 2, mu = rep(0, n_subjects),
        Sigma = Sigma)
    return(data)
}
run_simulation <- function(n_subjects, correlation) {
    data <- generate_correlated_data(n_subjects, correlation)
    t_test_result <- t.test(data[1, ], data[2, ])
    t_test_p_value <- t_test_result$p.value
    return(t_test_p_value)
}
p_values <- replicate(n_simulations, run_simulation(n_subjects,
    correlation))
p_value_data <- data.frame(PValue = p_values)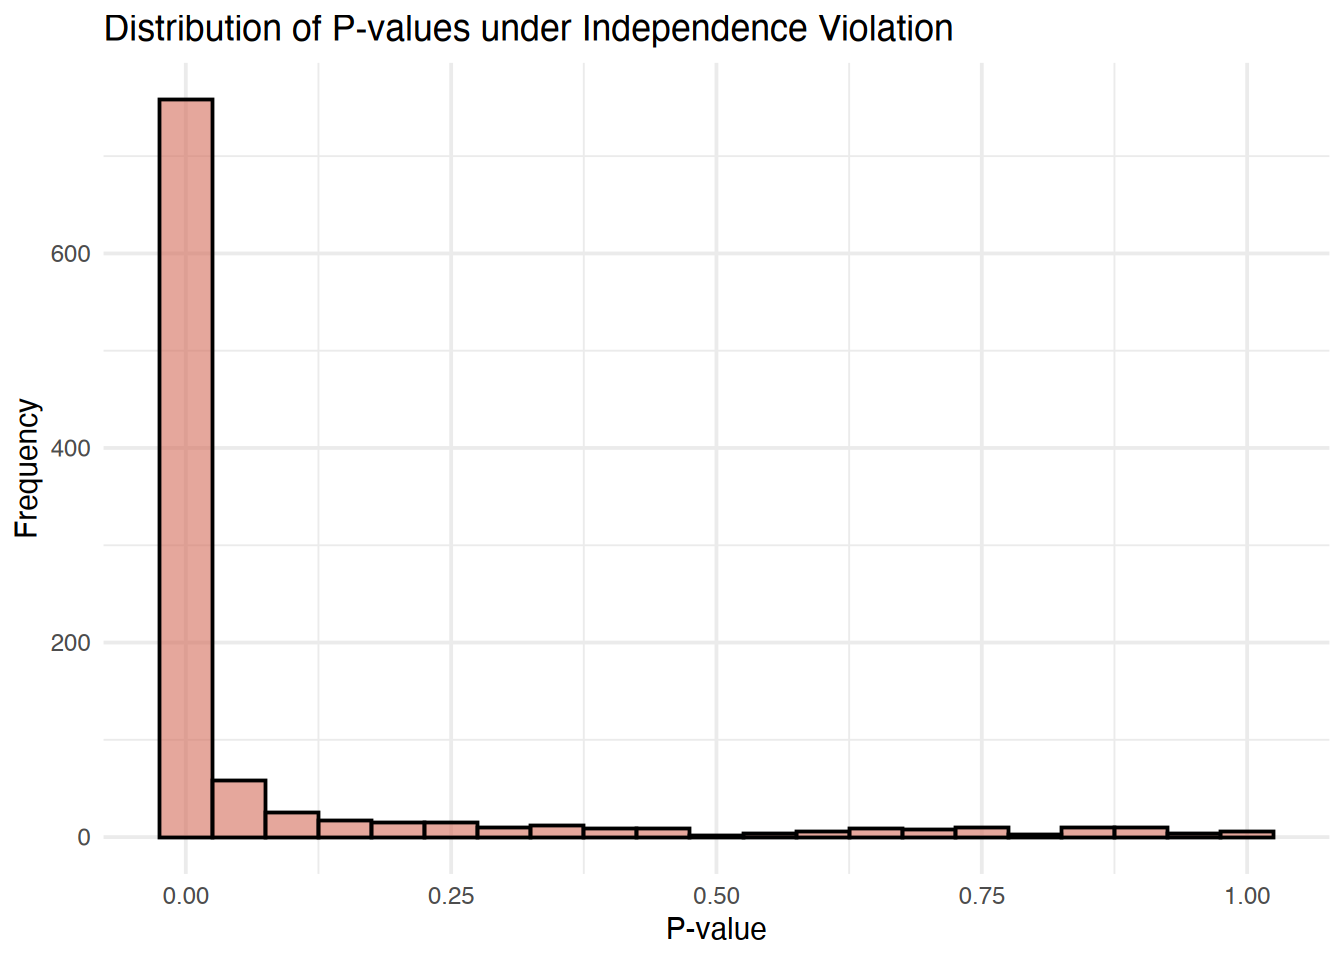
Deconditioning shifts the logical status of assumptions in the description of results from what is assumed as given (conditioned on) to an integral part of what is being checked by common statistics. This shift makes clear that the results might be explained by violations of background assumptions rather than, or in addition to, failure of a targeted hypothesis. Such deconditioning does not change calculations; hence it does not change any P-value, interval estimate, or posterior distribution. Instead, it provides a different interpretation of these statistics, one arising naturally in thorough contextual discussions, but which deserves more emphasis in basic statistical practice, including teaching and presentations.
In philosophical accounts of theory testing, it is well recognized that an apparent violations of a hypothesis may instead be due to violation of background or auxiliary assumptions (10–13). Among these assumptions are researcher competence and integrity in the conduct and reporting of statistical analyses which have come under scrutiny in the “replication crisis”) as well as common statistical assumptions such as linearity, outcome independence, and effect homogeneity, and methodological assumptions such as no uncontrolled confounding or selection bias. Perhaps because of this generality, we have found that our recommendation to decondition inferences (present inferences using an unconditional interpretation) (1,3) is often difficult for statistically sophisticated readers to comprehend or accept, and is even resisted, misunderstood, and misrepresented by some reviewers
Citation
BibTeX citation:
@misc{panda2024,
  author = {Panda, Sir and Panda, Sir},
  title = {Your {Models} {Are} {Neither} {Useful} {Nor} {Approximate}},
  date = {2024-01-01},
  url = {https://lesslikely.com/posts/statistics/assumptions},
  langid = {en},
  abstract = {A discussion about models and the assumptions that
    underlie them.}
}
For attribution, please cite this work as:
1. Panda S, Panda S. (2024). ‘Your Models Are Neither Useful Nor
Approximate’. Less Likely. https://lesslikely.com/posts/statistics/assumptions.