---
title: "GAMS"
author: "Sir Panda"
date: "2018-11-11"
description: "Some sample scripts"
categories:
- statistics
image: "https://raw.githubusercontent.com/stan-dev/logos/master/logo.png"
bibliography: references.bib
format:
html:
toc: true
code-fold: true
code-tools: true
execute:
warning: false
message: false
echo: true
cache: false
knitr:
opts_chunk:
fig.width: 7
fig.height: 5
fig.align: "center"
dev: "svg"
dpi: 300
---
```{r setup, include=FALSE}
# R options from .Rprofile
options(
digits = 3,
width = 130,
max.print = 100,
stringsAsFactors = FALSE,
useFancyQuotes = TRUE,
mc.cores = parallel::detectCores()
)
# Suppress messages for common packages
suppressMessages({
library(knitr)
library(ggplot2)
})
# Custom functions from .Rprofile
theme_less <- function() {
ggplot2::theme(
plot.title = ggplot2::element_text(hjust = 0.5, color = "#666666"),
plot.subtitle = ggplot2::element_text(hjust = 0.5, color = "#666666"),
plot.caption = ggplot2::element_text(color = "#666666"),
axis.title = ggplot2::element_text(hjust = 0.5, color = "#666666"),
panel.grid = ggplot2::element_rect(fill = "transparent", colour = "transparent"),
rect = ggplot2::element_rect(fill = "transparent", colour = "transparent"),
panel.background = ggplot2::element_rect(fill = "transparent", colour = "transparent"),
plot.background = ggplot2::element_rect(fill = "transparent", colour = "transparent"),
panel.grid.major = ggplot2::element_rect(fill = "transparent", colour = "transparent"),
panel.grid.minor = ggplot2::element_rect(fill = "transparent", colour = "transparent"),
strip.background = ggplot2::element_rect(fill = "transparent", colour = "transparent"),
strip.placement = ggplot2::element_rect(fill = "transparent", colour = "transparent"),
legend.background = ggplot2::element_rect(fill = "transparent", colour = "transparent"),
legend.box.background = ggplot2::element_rect(fill = "transparent", colour = "transparent"),
legend.key = ggplot2::element_rect(fill = "transparent", color = "transparent"),
axis.line.x = ggplot2::element_line(colour = "transparent", linetype = NULL),
axis.line.y = ggplot2::element_line(colour = "transparent", linetype = NULL)
) + ggplot2::theme_minimal()
}
# Custom colors
zred <- "#d46c5b"
```
```{r eval=TRUE, message=FALSE, warning=FALSE, errors=TRUE, include=FALSE}
req_packs <- c(
"rms", "mice", "magrittr", "tidyr", "future", "future.apply", "showtext", "concurve", "ggtext", "tidyverse", "rstan", "latex2exp", "MCMCpack", "quantreg", "miceadds", "missForest", "randomForest", "miceFast", "parallelly", "checkmate", "posterior", "kableExtra", "reticulate", "broom.mixed", "xfun", "mgcv",
"ggplot2", "parallel", "kableExtra", "cowplot", "Cairo", "svglite", "yardstick", "broom", "mi", "loo", "progress",
"Hmisc", "here", "VIM", "wesanderson", "bayesplot", "lattice", "doParallel", "blogdown", "Amelia", "pbmcapply", "mitml",
"ggcorrplot", "qqplotr", "car", "Statamarkdown", "rstan", "missForest", "htmltools", "tidybayes", "StanHeaders",
"summarytools", "performance", "mvtnorm", "ImputeRobust", "gamlss", "ProfileLikelihood", "reshape2", "JuliaCall",
"boot", "knitr", "MASS", "bootImpute", "brms", "rmarkdown", "tinytex", "texPreview", "pbmcapply"
)
suppressMessages(lapply(req_packs, library,
character.only = TRUE
))
```
```{r eval=TRUE, message=FALSE, warning=FALSE, errors=TRUE, include=FALSE}
opts_chunk$set(
collapse = TRUE,
prompt = FALSE,
dev = c('svglite'),
highlight = TRUE,
numberLines = FALSE,
fig.align = 'center',
class.output = c("hljs", "highlightjs"),
dev.args=list(bg = "transparent"),
engine.path = list(stata="/Applications/StataNow/StataMP.app/Contents/MacOS/StataMP",
python="~/Library/r-miniconda-arm64/bin/python3.9"),
cache = TRUE,
purl = FALSE,
cache.lazy = TRUE,
comment = "#>",
fig.retina = 2)
rmarkdown::find_pandoc(version = '2.14.2')
red <- zred <- "#d46c5b"
# Loggings messages
options(keep.source = TRUE)
options("tryCatchLog.write.error.dump.file" = TRUE)
# RStan Settings -------------------------------------
tropic_scheme <- rcartocolor::carto_pal(6, "Tropic")
color_scheme_set(tropic_scheme)
rstan_options(auto_write = TRUE)
pkgbuild::has_build_tools(debug = TRUE)
res_names <- c("Term", "Estimate", "Std.Error",
"Statistic", "df", "P.value")
if ((Sys.info()["sysname"]) == "Windows") {
curve_gen_path <- "C:/Users/zchow/Dropbox/LessLikely/R/curve_gen.R"
if (file.exists(curve_gen_path)) source(curve_gen_path)
} else if ((Sys.info()["sysname"]) == "Darwin") {
curve_gen_path <- "/Users/zad/Dropbox/LessLikely/R/curve_gen.R"
if (file.exists(curve_gen_path)) source(curve_gen_path)
}
```
```{r echo=TRUE, message=FALSE, warning=FALSE}
library(mgcv) # Fit and interrogate GAMs
library(tidyverse) # Tidy and flexible data manipulation
library(marginaleffects) # Compute conditional and marginal effects
library(ggplot2) # Flexible plotting
library(patchwork) # Combining ggplot objects


plant <- CO2 |>
  as_tibble() |>
  rename(plant = Plant, type = Type, treatment = Treatment) |>
  mutate(plant = factor(plant, ordered = FALSE))
```
------------------------------------------------------------------------
```{r echo=TRUE, error=TRUE, message=FALSE, warning=FALSE, paged.print=TRUE}
model_1 <- gam(
uptake ~ treatment * type +
s(plant, bs = "re") +
s(conc, by = treatment, k = 7),
data = plant,
method = "REML",
family = Gamma(link = "log")
)
summary(model_1)
coef(model_1)
```
------------------------------------------------------------------------
```{r echo=TRUE, error=TRUE, message=FALSE, warning=FALSE, paged.print=TRUE}
plot(model_1, select = 2, shade = TRUE)
abline(h = 0, lty = "dashed")
```
------------------------------------------------------------------------
```{r echo=TRUE, error=TRUE, message=FALSE, warning=FALSE, paged.print=TRUE}
plot_predictions(model_1,
  condition = "conc",
  type = "link"
) +
  labs(
    y = "Linear predictor (link scale)",
    title = "Average smooth effect of concentration",
    subtitle = "Aggregated across treatments and types"
  )
```
------------------------------------------------------------------------
```{r echo=TRUE, error=TRUE, message=FALSE, warning=FALSE, paged.print=TRUE}
plot_predictions(model_1,
  condition = c("conc", "treatment", "type"),
  type = "link"
) +
  labs(
    y = "Linear predictor (link scale)",
    title = "Average smooth effect of concentration",
    subtitle = "Per treatment, per type"
  )
```
------------------------------------------------------------------------
```{r echo=TRUE, error=TRUE, message=FALSE, warning=FALSE, paged.print=TRUE}
plot_slopes(model_1,
  variables = "conc",
  condition = c("conc", "treatment"),
  type = "link"
) +
  geom_hline(yintercept = 0, linetype = "dashed") +
  labs(
    y = "1st derivative of the linear predictor",
    title = "Conditional slopes of the concentration effect",
    subtitle = "Per treatment, per type"
  )
plot_predictions(model_1,
  condition = "conc",
  type = "response", points = 0.5,
  rug = TRUE
) +
  labs(
    y = "Expected response",
    title = "Average smooth effect of concentration",
    subtitle = "Aggregated across treatments and types"
  )
plot_predictions(model_1,
  condition = c("conc", "treatment", "type"),
  type = "response", points = 0.5,
  rug = TRUE
) +
  labs(
    y = "Expected response",
    title = "Average smooth effect of concentration",
    subtitle = "Per treatment, per type"
  )
plot_slopes(model_1,
  variables = "conc",
  condition = c("conc", "treatment", "type"),
  type = "response"
) +
  geom_hline(yintercept = 0, linetype = "dashed") +
  labs(
    y = "1st derivative of the expected response",
    title = "Conditional slopes of the concentration effect",
    subtitle = "Per treatment, per type"
  )
```
------------------------------------------------------------------------
```{r echo=TRUE, error=TRUE, message=FALSE, warning=FALSE, paged.print=TRUE}
Xp <- predict(model_1, type = "lpmatrix")
dim(Xp)
colnames(Xp)
beta <- coef(model_1)
all.equal(names(beta), colnames(Xp))
```
------------------------------------------------------------------------
```{r}
preds <- as.vector(Xp %*% beta)
all.equal(fitted(model_1), exp(preds))
newXp <- predict(model_1,
type = "lpmatrix",
newdata = data.frame(
plant = "Qn1",
treatment = "nonchilled",
type = "Mississippi",
conc = 278
)
)
dim(newXp)
exp(newXp %*% beta)
```
------------------------------------------------------------------------
```{r}
conc_seq <- seq(from = min(plant$conc), max(plant$conc), length.out = 500)
newdat <- data.frame(
conc = conc_seq,
plant = "Qn1",
treatment = "nonchilled",
type = "Mississippi"
)
newXp <- predict(model_1, type = "lpmatrix", newdata = newdat)
conc_coefs <- model_1$smooth[[2]]$first.para:model_1$smooth[[2]]$last.para
conc_coefs
```
------------------------------------------------------------------------
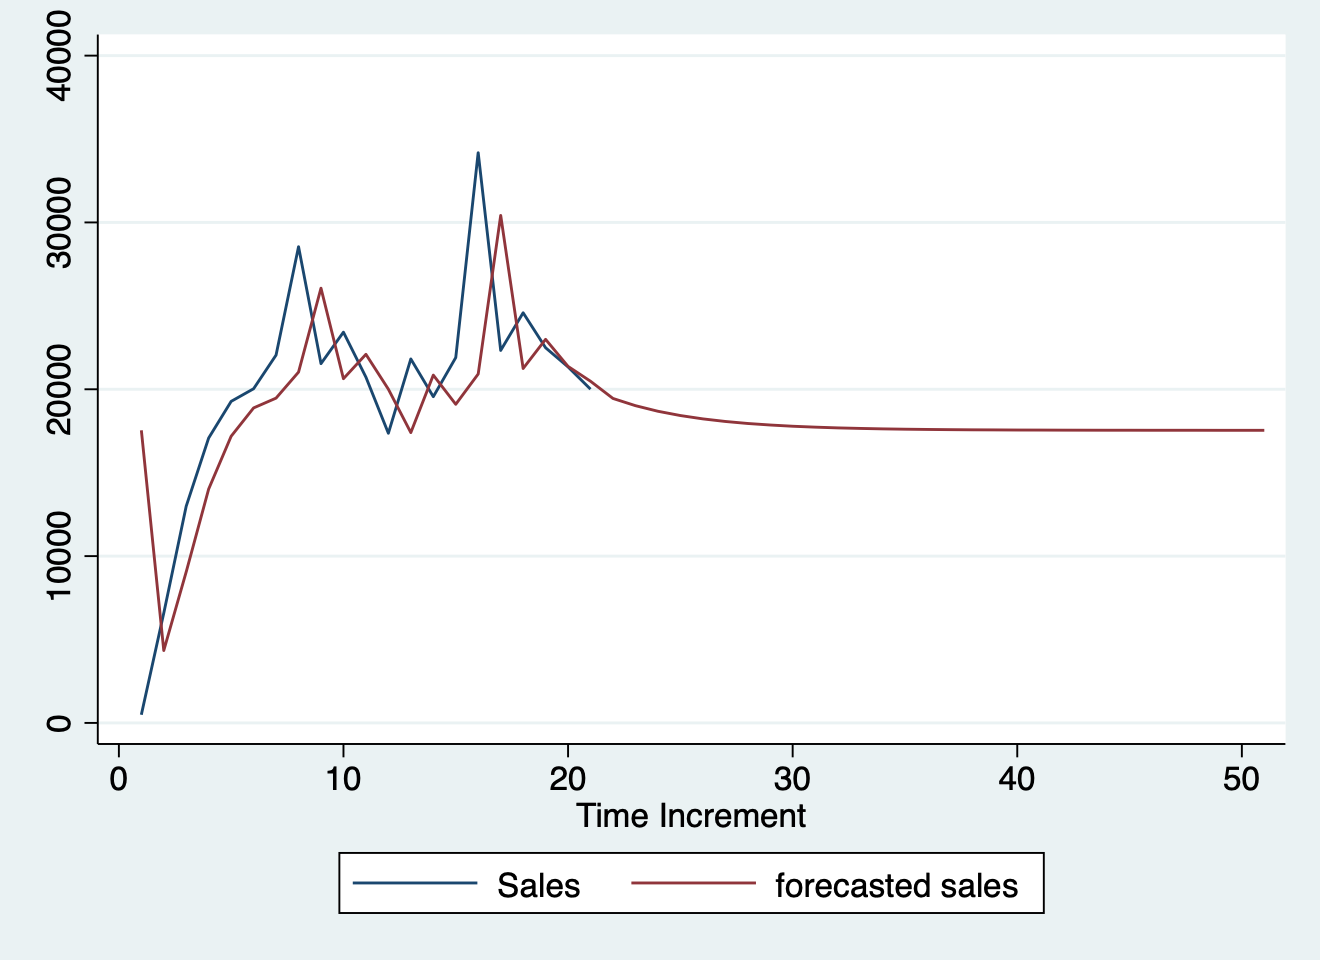
<figure>
<img src="/post/statistics/forecastedsales.png" width="700" style="cursor: zoom-in"/>
<figcaption>Trace plot of imputed datasets.</figcaption>
</figure>
------------------------------------------------------------------------
## Python
------------------------------------------------------------------------
```{r echo=TRUE, error=TRUE}
model_2 <- glm(
  uptake ~ treatment * type +
    poly(conc, 4) * treatment + plant,
  data = plant,
  family = Gamma(link = "log")
)
plot_predictions(model_1,
  condition = c("conc", "treatment", "type"),
  type = "response", points = 0.5,
  rug = TRUE
) +
  labs(
    y = "Expected response",
    title = "Average smooth effect of concentration",
    subtitle = "Per treatment, per type"
  )
plot_predictions(model_2,
  condition = c("conc", "treatment", "type"),
  type = "response", points = 0.5,
  rug = TRUE
) +
  labs(
    y = "Expected response",
    title = "Average smooth effect of concentration",
    subtitle = "Per treatment, per type"
  )
```
------------------------------------------------------------------------
## R
------------------------------------------------------------------------
```{r eval=TRUE}
avg_comparisons(model_1,
newdata = datagrid(
conc = conc_seq,
treatment = unique,
type = unique
),
variables = "treatment",
by = "type"
)
avg_comparisons(model_1,
newdata = datagrid(
conc = conc_seq,
treatment = unique,
type = unique
),
variables = "treatment",
by = c("conc", "type")
)
plot_comparisons(model_1,
newdata = datagrid(
conc = conc_seq,
treatment = unique,
type = unique
),
variables = "treatment",
by = c("conc", "type"),
type = "link"
) +
geom_hline(yintercept = 0, linetype = "dashed") +
labs(
y = "Estimated difference",
title = "Difference between treatment levels",
subtitle = "Chilled - nonchilled, per type"
)
```
------------------------------------------------------------------------
## Stata {#stata}
------------------------------------------------------------------------
```{r echo=TRUE, error=TRUE, message=FALSE, warning=FALSE, paged.print=TRUE}
max_growth <- function(hi, lo, x) {
dydx <- (hi - lo) / 1e-6
dydx_max <- max(dydx)
x[dydx == dydx_max][1]
}
comparisons(model_1,
newdata = datagrid(
conc = conc_seq,
treatment = unique,
type = unique
),
variables = list("conc" = 1e-6),
vcov = FALSE,
by = "treatment",
comparison = max_growth
)
hypotheses(slopes(model_1,
newdata = datagrid(
conc = conc_seq,
treatment = unique,
type = unique
),
variables = "conc",
by = c("conc", "treatment"),
type = "link"
)) %>%
dplyr::filter(p.value <= 0.05)
```
```{=html}
<iframe title="m" width="640" height="541.25" src="https://app.powerbi.com/reportEmbed?reportId=c377c2a0-a702-4d33-a8ce-b454a5f69302&autoAuth=true&ctid=85539884-d6cb-44b5-a575-20470b81d1d5" frameborder="0" allowFullScreen="true"></iframe>
```
<iframe title="nb" width="1140" height="541.25" src="https://app.powerbi.com/reportEmbed?reportId=9f3a36c5-18a8-436e-85cf-145ac593b7fc&autoAuth=true&ctid=85539884-d6cb-44b5-a575-20470b81d1d5&actionBarEnabled=true&reportCopilotInEmbed=true" frameborder="0" allowFullScreen="true"></iframe>
------------------------------------------------------------------------
# Computational Environments
------------------------------------------------------------------------
## Overall Platforms
------------------------------------------------------------------------
```{r SessionInfo, echo=TRUE, message=FALSE, warning=FALSE, paged.print=TRUE}
sessioninfo::session_info(info = c("platform", "external"))
```
------------------------------------------------------------------------
## `R` Packages
------------------------------------------------------------------------
```{r echo=TRUE, message=FALSE, warning=FALSE, paged.print=TRUE}
sessioninfo::session_info(info = "packages")
```
------------------------------------------------------------------------
# References {#references}
------------------------------------------------------------------------


Comments
Comments are loaded on demand so they don’t slow down the initial page render.